The data from the Corona crisis
Corona Crisis
Here is shown how one can access and analyse the spread of the Corona virus. Fortunately the data is provided by Johns Hopkins University via GitHub.
Accessing the data
The data is delivered in three CSV-Files one for the confirmed cases, one for die number of people that died and finally one for the number of recovered people, that were positive tested but got fully recovered.
My workflow is to get the data from GitHub and place the whole folder at an location were I usually store my data sets. The I can simply change the data when new ones are available. So reading is is done via the Mathematica function Import
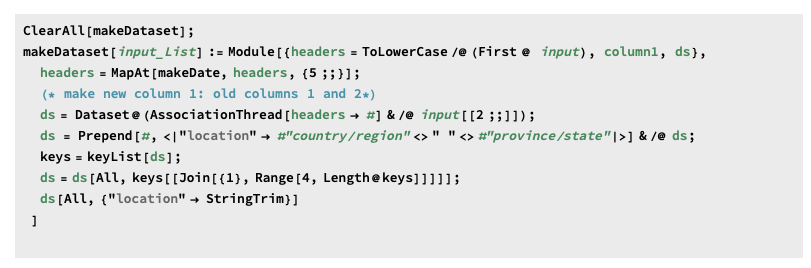
Making a dataset
The dataset has the following general structure. First column holds data of Province or state (e.g. Hubei) next column contains information about the country or the region (e.g. China). The following two columns are the geo-coordinates for the country. Starting from column 5 the data for the corresponding day follows. In the next step we form a dataset form the data

We now need a hleper function to transform the given date from "1/22/20" for the 22nd of January to the form {year, month, day}, which is {2020, 1, 20}. this is done with the function makeDate

In the next steps, we create a Dataset structure and prepend a new column „location“ to it, because we do not use the detailed location structure here
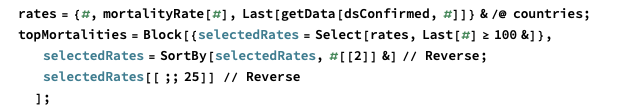
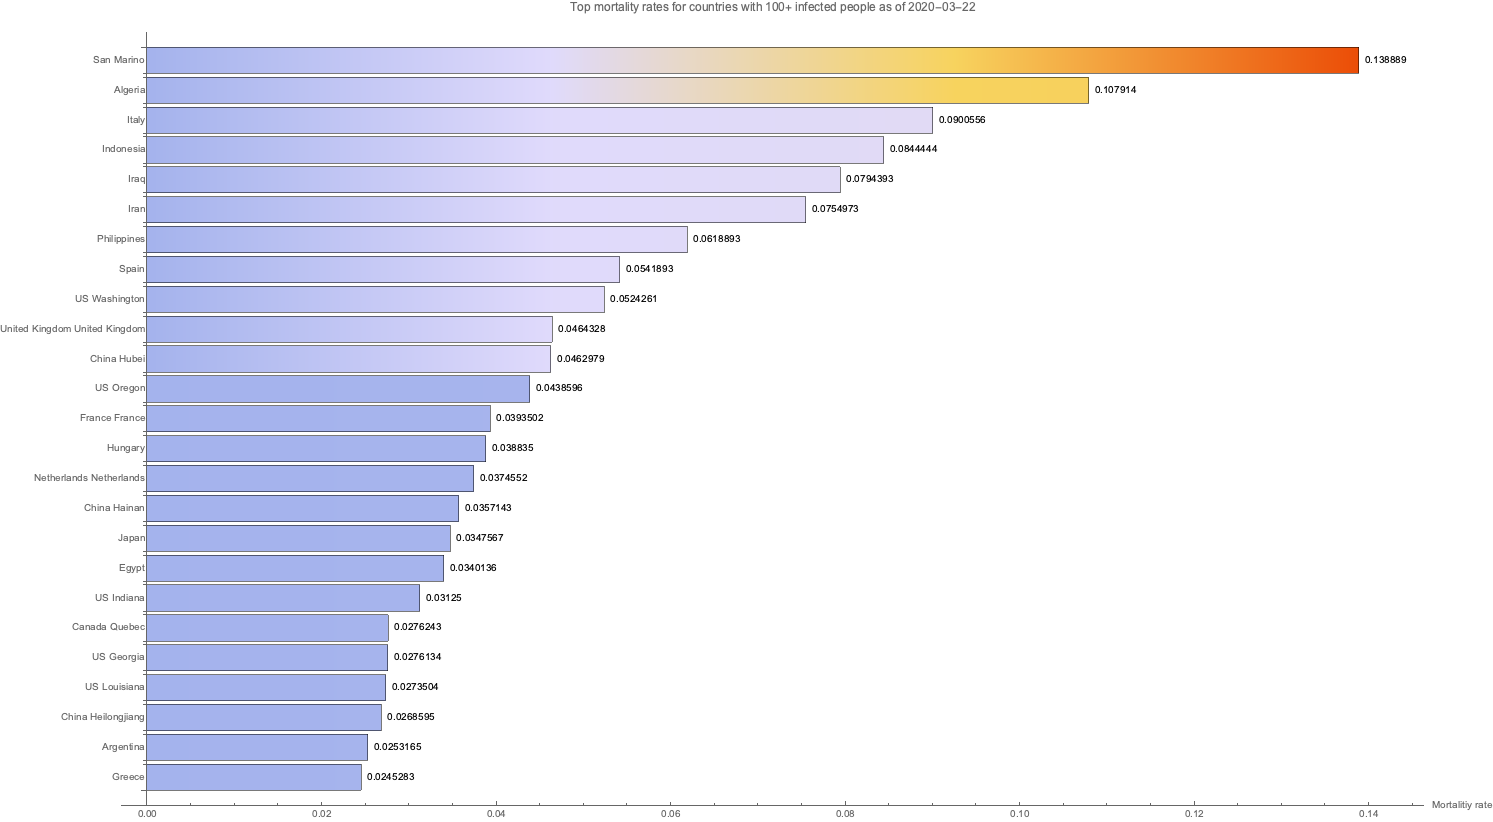
Computing the Mortality Rate
with the given data it is easy to compute the acutal mortality rate for every country in the data base. Here we take only such countries into account for which there are more than 100 confirmed cases

Download
These files are all "under construction". I work on the notebook on a daily basis, so frequent changes are inevitable.
Open Notebook in Browser
PDF
Notebook